Overview
This activity starts by reviewing how function calls work, and then moves on to examine simple function definitions. Be sure to look at all readings and videos, including the class notes document. before jumping into this activity!
Key ideas:
Functions are names for a set of instructions that operate on provided data.
A function has:
- A name
- A set of input parameters: to run, the function needs a value for each input parameter
- A body, which is the set of statements to perform when the function is called.
Function definitions
Remember the format for a function definition. A function definition needs to specify (1) the name of the function, (2) the inputs to the function, and (3) what should happen when the function is called including what value should be returned, if any. Below is an outline of what a function definition looks like–it’s not a real function, though.
A function definition has a header line that defines the function name and its input parameters. It then has an indented body, the statements to run. The function does not run when you make a definition. It only runs when you call the function.
Think of this metaphor:
| Functions | Cooking |
|---|---|
| function definition | recipe |
| function call | cook makes the food! |
Environments
An environment is the set of variables and function names that are defined during the run of a program. * Environment is a table mapping variable/function names to their values
- Global environment: All global variables, all functions defined at the global level, are stored here. It lasts throughout the run of the program
- Local environment: A local environment is made when we call a function, holding the function’s variables. It is created at the start of the function call, and lasts until the function call ends.
Tracing functions by hand
To gain a better understanding of how functions work, we will trace by hand what happens when a call is made to a function we have defined. We will also try other tools within Python and PyCharm and elsewhere such as the Online Compiler, Visual Debugger, and AI Tutor to help us visualize what is happening.
Try this to hand in: Save your answer for this activity into a Python file called tracing.py.
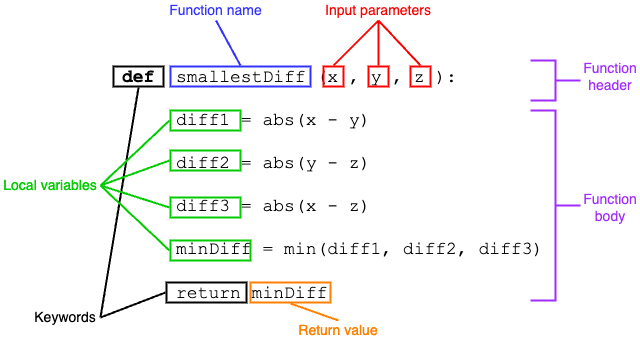
Consider the following function, which was used to show tracing by hand in videos/class notes, as well. The smallestDiff function takes in three numbers and returns the smallest difference between the three numbers.
Figure 1 labels the key elements of this function.
smallestDiff
x,y, andzare the (formal) input parameters.diff1,diff2,diff3, andminDiffare local variables, only existing within the function (as arex,yandz).- This function calls other functions, built-in Python functions
absandmin, to help do its job. - The return values of
absandminare stored into variables to keep track of them. - The return value of
smallestDiffis the value ofminDiff.
When we trace a function by hand, we write out the local environment at the start of the function call, and update it whenever a variable is altered or a new variable is added. We showed this in the videos for today.
Copy the definition of smallestDiff to the file you created. But before running it, trace the function call below by hand. Draw the local environment table (you can just put it in the Python file as a comment). Just draw the final state of the local environment, just before the functionr returns.
Once you are sure what the return value would be for this call, add this call to your file, printing the result. Were you right? If so, move on. If not, ask for help!
Next add the function definition below to your file. This function takes in the price of an item at a store, and the sales tax rate, and it calculates what the total price to be paid is.
Trace this function with the call shown below, drawing the local environment table for this function. Notice that the returned value is not just a value stored in a variable, but an arithmetic expression. That’s okay, it doesn’t get added to the local environment table, just returned.
Tracing functions using print
Instead of walking through a function call by hand, you can have the computer print out the relevant pieces of information for you. The most helpful places you can add print statements include:
- At the start of the function (to print the values of input parameters)
- Inside
forloops (to print loop variables and accuumulators) - Inside
ifstatements (to tell which case of theifactually ran) - Just before a
returnstatement (to print the return value)
Try this to hand in: Save your answer for this part into the same Python file as before.
Add the following line to the definition of smallestDiff, by adding a line just below the function header (the def line), don’t forget to indent it in order to be a part of the function’s statements.
This line will print the input parameter values, so we can check that they are what we expect.
Then add the following line just before the return line, also indented to be a part of the function.
This will print the local variables, and especially the variable holding the return value, so we can check that each line did what we wanted it to.
Finally, make sure there is a call to smallestDiff in the script part of the file, and run it. See what gets printed.
Try this to hand in: Come up with print calls to add to addTax to show the input parameters’ values and the local variable’s value. Also print the expression that is the return value.
Note: In the examples of print statements provided here, we have been careful to include explanatory text when printing data for testing, debugging, or tracing a function. This is generally good practice: it will make your life easier when reading outpu from your program!
Tracing functions using the PyCharm debugger
PyCharm provides a tool called a debugger which can be used to step through a program line by line, checking on the values of all the variables at that moment in time. To use the debugger, put a call to the function you want to debug into the file, after the function definition.
When you run the debugger, it runs your file as normal, except that we can ask it to stop at any step of the program, so that we can examine what the program is doing and what the local and global environment looks like. A breakpoint is a place where the debugger will stop normal execution of the function, and will allow you to examine the state of every variable, and to continue running the program step-by-step if you wish.
We will comment out the print statements from the previous section, and then see how the debugger can show us the same kind of information.
- Comment out any print statements inside
smallestDiffandaddTax. - Make sure the script part of the code includes at least one call to
smallestDiffat the bottom of the file. - Add a breakpoint at the first line inside the body of the
smallestDifffunction. To add a breakpoint, click the mouse either on the line number or in the bar just to the right of the line number. A red dot will appear there. - Run the debugger by clicking on the Debug, you click on the Debug button, rather than the Run button. It looks like a bug. The debugger should run the file up to the point where the breakpoint is, and then pause.
A Debug tool window should appear at the bottom of your PyCharm Window. It should look similar to Figure 2, which labels four important parts of the Debug panel. We will briefly go over this tool window here, but for more details, look at the “Debug tool window” documentation.
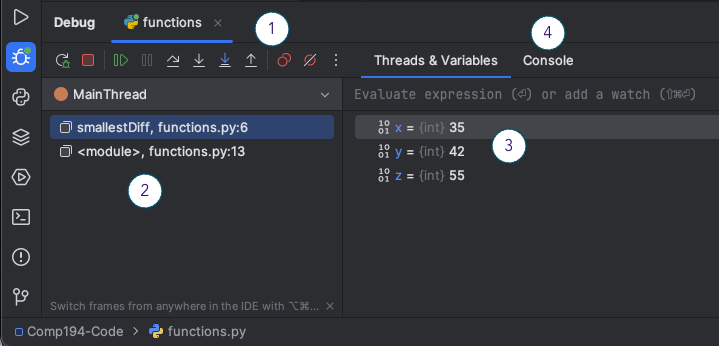
Item 1: The number 1 highlights the debugger controls. If you hover over each icon, it will display its meaning. From left to right, the icons perform the following:
- Rerun the program, same as the Run panel
- Stop running the program, same as the Run panel
- Resume running the program, will stop at next breakpoint, if any
- Pause program
- Step Over, will perform just the next step, skipping over any function calls it contains
- Step Into, will perform just the next step, and will move into any function calls to step through them
- Step Into My Code, will perform just the next step, and will move into any of your function calls, stepping over any others
- Step Out, will move forward to the end of the current function, and stop at the next statement after the function call
Item 2: This section of the tool window shows the call stack. Remember that the call stack keeps track of the sequence of function calls that have been made and are currently active (look at the Happy Robot Metaphor). Each row of information here shows an active function call, and what line the call is on. Here, the top line shows that smallestDiff is the current function being executed, and we are stopped just before line 6. The line below shows where in the code we called smallestDiff: in this case, in the main script at line 13.
Item 3: This section shows the environment table for the current function call at the current step. Notice that if you click on the
Item 4: This item is highlighting the Console tab, which allows you to see the typical program output, anything that the program may have printed. You can also interact with your program in the Console if it calls the input function.
If we click the Step Over button several times, we will see the view shown in Figure 3.
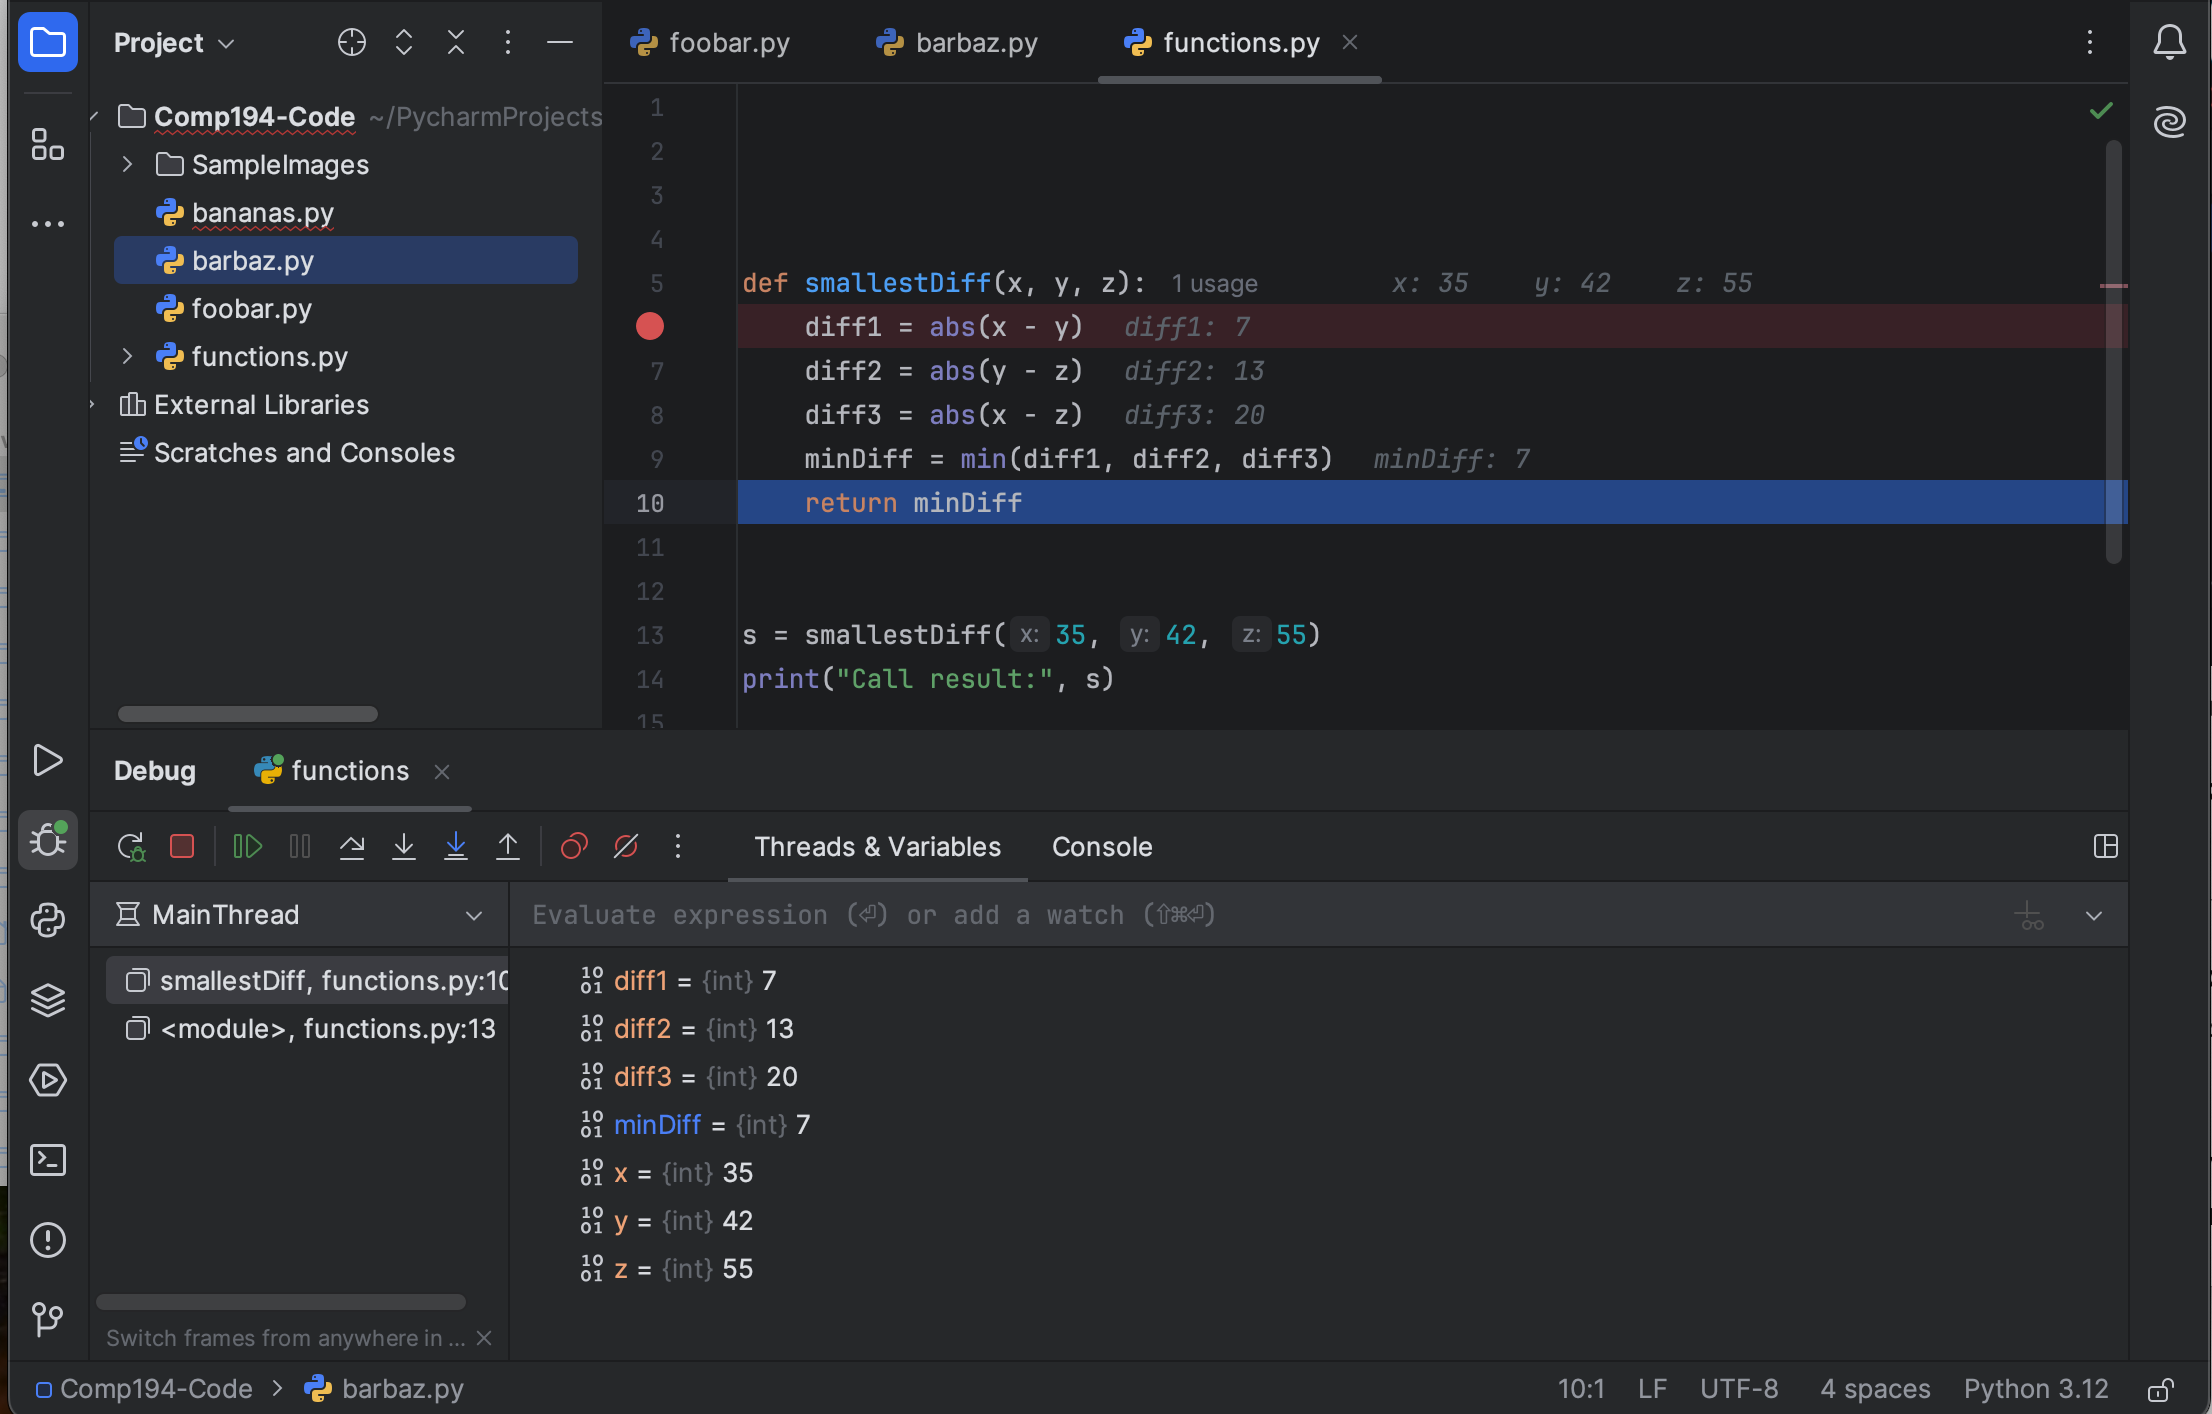
Notice that the Threads & Variables section now has the full environment table for smallestDiff(35, 42, 55) up to the return line. And notice that PyCharm has decorated the source code in the editor panel with information from the debugger, including the values for each variable, and what the return value should be.
Practice with tracing and debugging
You have been provided with a starter program in barChart.py. This program includes a function definition, and then a main script that sets up an image and data, and runs the drawBarChart function, displaying the result. The drawBarChart function is copied below.
This program is supposed to draw a bar chart based on some number data stored as a list. One bar per number, and the height of the bar should be proportional to the value of the number, with the tallest bar close to the height of the image.
def drawBarChart(image, chartData):
(wid, hgt, dep) = image.shape
numItems = len(chartData)
maxValue = max(chartData)
colWidth = wid // numItems
barWidth = colWidth - 16
currX = 8
for datum in range(len(chartData)):
barHeight = int((datum / maxValue) * hgt)
p1x = currX
p1y = hgt - barHeight
p2x = currX + colWidth
p2y = hgt
cv2.rectangle(image, (p1x, p1x), (p2x, p2y), (0, 0, 255), -1)
currX += colWidth- 1
- Determine the size of the image
- 2
- How many bars must be drawn?
- 3
- What is the largest value in the data (will be tallest bar)
- 4
-
colWidthis the width of the bar plus the gap,barWidthis the width of the bar alone - 5
- Start the first bar 8 pixels from the left edge
- 6
-
Iterate over the values in
chartData - 7
- Compute the height in pixels of the current bar
- 8
- Compute the coordinates of the upper-left corner of the bar
- 9
- Compute the coordinates of the lower-right corner of the bar
- 10
- Draw the bar as a blue filled-in rectangle
- 11
-
Update
currXto the next bar’s location
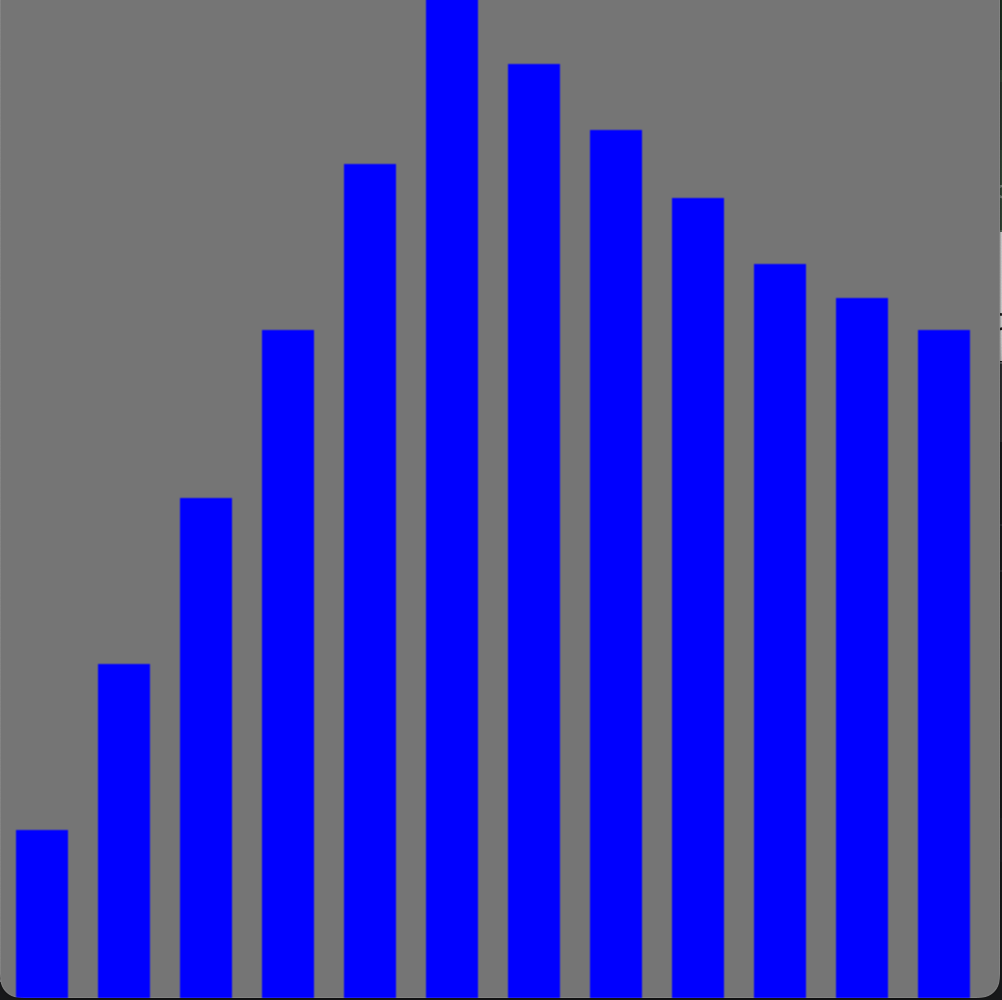
The correct result for this program is shown in Figure 4 below. However, this code has four bugs in it, all logical errors. That means the program runs, but produces the wrong result.
- Use by-hand tracing, print statements, and/or the PyCharm debugger to determine the bugs in this program. Make notes in comments in the file about what you tried.
- When you find a bug, add a comment to that line of the code describing the bug
- Fix the bug if you can (or ask for help)
Defining and testing new functions
Try this to hand in: Create a single code file where you implement each function below. Organize the code file with import statements at the top, function definitions next, and then a single main script at the bottom that includes one or two demo calls to each function.
- Define a function called
ave3that takes three numbers as inputs:x,y,z. It should compute the average of the three by adding them up and dividing by 3.0. It should return the resulting value.
To test your program automatically when the file is run, put calls to the function in the main script at the bottom of your file as shown below. Make sure the calls are not indented.
Test the function on multiple different inputs, verifying for each that it returns the correct value. Use one of the tracing methods described above to help debug your function, if needed.
Define a function called
randomStringthat takes in a list of strings and a numbernas inputs. It should build and return a new string that containsncopies of strings from the input list, chosen at random. You will need:- a
forloop that repeatsntimes’ - an accumulator variable to hold the new string
- each time through the loop, to use the
random.choicefunction to choose a random string from the list
- a
Define a function called
addBorderthat takes in an image, a number of pixels, and a color tuple. It should make and return a copy of the input image, with a border around the outside of the image, that is the number of pixels wide, and drawn in the given color. Hint: use four calls to therectanglefunction to draw the borders, calculating the points for each rectangle.Define a function to print the first \(n\) digits of your favorite sequence. It should take in one input,
nand it does not need to return anything (because it is a printing function). You choose the sequence, some good candidates are listed here:- 1, 2, 3, … , \(n\)
- 2, 4, 5, … , \(2n\)
- 1, 4, 9, … , \(n^2\)
- Fibonnaci sequence: 1, 1, 2, 3, 5, 8, … , \(F_{n-1} + F_{n-2}\) (this is a bit of a challenge)
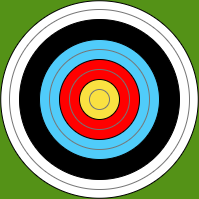
Define a function
drawTargetthat takes in an image to draw on, and an (x, y) tuple for the position where the target should be centered. Draw a version of the traditional archery target on the input image, with concentric circles: yellow in the middle, red, blue, black, and white going outwards (see Figure 5 for an example).
While archery targets like this one technically have two rings of each color, you do not need to draw those, just one circle for each color (unless you want the challenge).
What to hand in
You should have multiple Python files for this activity. At the very least, you must have:
- A file containing your experiments with tracing,
tracing.py - A file containing your updates and changes to
barChart.py - A file containing your function definitions
Use commit and push to copy your code to Github to submit this work.